Finding the Real Reasons Jenkins Jobs Fail: Elasticsearch, a Hybrid Classifier and a Claude Reporting Agent
Nov 1, 2026 · @Mahima
Across 4 Jenkins instances and 3000+ jobs, we turned an unreadable pile of failures into a ranked, routable list of causes: unclassified failures fell from about 40% to 10-15%, 789 chronically failing jobs were identified, and peak-time load dropped 36%.
TL;DR
- Problem: 4 Jenkins instances and 3000+ jobs, with no visibility into why jobs fail or which causes to fix first.
- Approach: failure analysis outside Jenkins (Logstash, Elasticsearch, Grafana), regex rules maintained through pull requests, an ML classifier for the long tail, and a weekly report written by a Claude agent through a read-only Grafana MCP server.
- Results: unclassified failures down from about 40% to 10-15%, 789 chronically failing jobs identified, and peak-time load down 36%.
My role. I proposed this project and built the pipeline, dashboards, classifier and reporting agent described below.
The problem: failures everywhere, visibility nowhere
Our CI estate is four Jenkins instances, each serving a different purpose, with more than 3000 jobs. About 600 of them run every day: maintenance, upgrades, integration tests per agent, per OS flavour and per supported version, promotions and acceptance tests.
The topology makes failures hard to explain. Controllers run in a data center, workers are provisioned on a GKE cluster, and test jobs request temporary VMs from vmpooler, which can land in the data center, AWS or GCP. Packages live in JFrog Artifactory, and other services such as ABS sit in the path. A single red build can come from:
- a network problem between any two of those pieces
- a service being down (vmpooler, ABS, Artifactory)
- an OS-specific issue
- a job configuration error
- a faulty build agent
- memory exhaustion
Nobody could say which of these caused the most failures, so triage was driven by whoever shouted loudest. Failures also cascade. A job that fails after provisioning leaves its VMs unused but still holding capacity, in some cases 300+ at a time, and automatic retries multiplied the damage. We needed to see why jobs fail before we could decide what to fix first.
Starting point: the Build Failure Analyzer plugin and its limit
We began with the Build Failure Analyzer (BFA) plugin. You maintain a knowledge base of regex patterns, and BFA matches failed builds against it and shows the cause on the build page.
It worked, but it does all of its matching on the controller. That is the wrong place for it. When a major issue makes pipelines fail in bulk, every failed build triggers regex matching against dozens of patterns, adding load to a controller that is already struggling. A tool meant to diagnose an incident could make the incident worse.
So we set one rule: analysis happens outside Jenkins.
BFA had a second problem. Anyone could add patterns, and over time developers piled up many overlapping regexes with no review. We wanted the knowledge base to stay clean as it grew.
Architecture
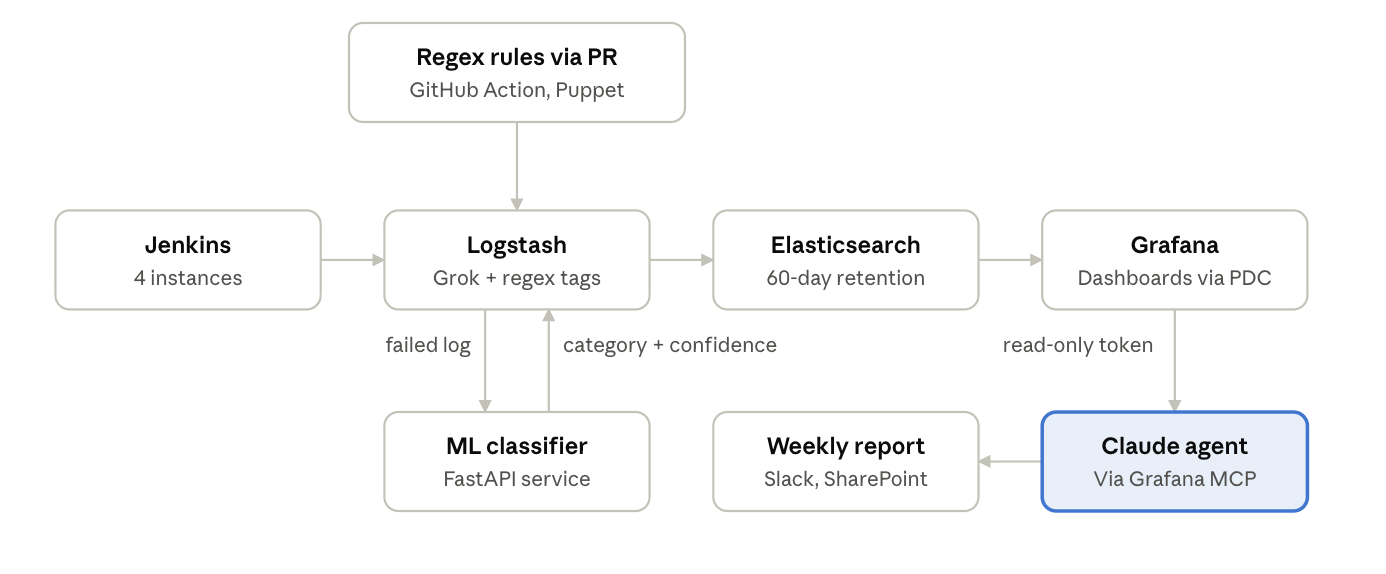
Jenkins only ships console logs. Logstash cleans them, tags known failures with regex and asks the classifier about the rest. Elasticsearch stores the result for Grafana dashboards, and a Claude agent reads the same data through Grafana's read-only MCP server to write the weekly report.
Classification: regex first, ML for the long tail
Regex alone has a ceiling: if no pattern matches, the failure is "unclassified", and about 40% of our failures landed there. We also wanted broader categories than individual patterns give, because different teams care about different failures:
- DevOps wants infrastructure failures.
- IT wants SSL and network problems.
- Developers want package and internal failures.
- Job owners want to see job configuration issues.
Building the training data. We first wrote regex rules by hand and collected real failure logs labelled by them. We then used AI to propose failure reasons and categories for logs the rules missed, and a human reviewed these labels before any training. Low-confidence labels were filtered out so noisy examples did not teach the model the wrong thing.
The model. A deliberately simple, CPU-friendly pipeline that can run inside a log pipeline:
- Logs are cleaned first: ANSI codes stripped, UUIDs and long hex strings redacted, and timestamps, paths, URLs, IPs, versions, hostnames and exit codes normalized so the model learns patterns, not one-off values.
- Features are TF-IDF over word unigrams and bigrams (up to 5,000 features), plus binary keyword flags for known signals such as OOM, disk full, network, permissions, test failures, dependencies, containers and databases.
- A scikit-learn Logistic Regression with balanced class weights predicts one of six categories: Infrastructure Failure, Job Failure, Memory Issue, Shell script exited with failure, Test Failure and Workspace/Env Failure.
- Classes are capped during balancing so common failures do not drown out rare ones.
Serving. The model sits behind a small FastAPI service. Logstash sends each failed build's log to it and attaches the predicted category, confidence and processing time to the event before it reaches Elasticsearch. Fixed rules for unambiguous signals such as OOM, disk full and permission errors run before the model.
Rollout. The classifier ran in a staging environment for a period of testing and verification before we promoted it to production.
Making it easy for developers to contribute
Asking a developer who has never used Logstash to edit a Logstash config is a nightmare, and we also wanted version control over every change. All server configuration is managed through Puppet, so we put the regex knowledge base behind a pull request flow:
- A developer proposes a pattern for a failure they keep seeing.
- A GitHub Action checks whether an existing regex already covers it.
- If it is covered, the PR is rejected as a duplicate. If not, the pattern is added.
- Puppet rolls the updated rules out to the Logstash servers.
Every rule has an author, a review and a history, and the regex sprawl that hurt us with BFA is contained by design.
The AI agent: weekly reports instead of ever-longer retention
Once the dashboards existed, people asked for longer retention. Keeping more raw console logs costs a lot of storage, so we looked for another way to preserve long-term insight.
We built an agent on Claude that produces a weekly report automatically. It highlights which failure categories rose, which Jenkins instances are healthy, and which incidents mattered most. The report goes to a Slack channel for the team and to SharePoint as a permanent reference. The weekly reports now carry the long-term trend, while detailed logs stay at 60 days.
How the agent gets its data. The agent uses the Grafana MCP (Model Context Protocol) server, so it reads the same enriched Elasticsearch data our dashboards show, through Grafana's existing data source, instead of scraping logs.
Read-only by design. The MCP server runs in read-only mode, so the agent can query and summarize but cannot change dashboards or data. Access uses a read-only Grafana token supplied through an environment variable, so no credentials live in code and the agent never holds Elasticsearch credentials.
Why Grafana MCP, not Elasticsearch directly. Grafana is already the single place where our data sources meet. If we want the weekly report to include vmpooler uptime or ABS VM capacity problems, we add those as Grafana data sources and the agent can query them through the same MCP server and the same read-only token. Reports can grow with new signals without writing a new integration each time, and the capacity and outage data are exactly what we need to explain failures such as VMs being unavailable.
Incident awareness. Failures carry metadata that links them, so a burst of hundreds of failures from one vmpooler outage can be recognized as one incident, not hundreds of separate problems.
Results
| Outcome | Result |
|---|---|
| Unclassified failures | About 40% before, 10-15% after the hybrid classifier |
| Chronically failing jobs found | 789 jobs failing for at least one month, disabled until their owners fix them |
| Peak-time load | Reduced by 36% after scattering scheduled jobs |
| Top failure causes | 1. Test failures. 2. Installer and pre-suite setup failures after new product versions. 3. VMs unavailable because of capacity limits |
Test failures leading the list is expected, since that is what CI exists to catch. The other two are more actionable: setup failures cluster around new product versions, and capacity shortages point to a platform limit, not a bug in any job.
Scheduling. The data showed many teams' scheduled jobs requesting VMs at the same moment. Spreading them across time slots cut peak-time load by 36%.
What it did not fix. Many jobs are long-running, so failure rates stayed a problem and wasted VMs were reduced, not eliminated. What we gained was knowing which jobs fail continuously while also consuming VMs, which let us stop the biggest repeat offenders.
Lessons and what is next
The system gave us visibility, and it also showed where it can go further:
- Rank causes by cost, not count. Ingest vmpooler data so failures can be ranked by VM-hours wasted, which turns "300+ wasted VMs" into a measured metric.
- Report incidents and rates. Lead the weekly report with grouped incidents, and compare failure rates per instance instead of raw counts, since more builds can mean more failures without anything getting worse.
- Keep weekly aggregates as data. Store each week's rollup in a small structured index so quarter-over-quarter questions need no raw logs.
- Make uncertainty explicit. Add a calibrated confidence threshold so low-confidence predictions are reported as "uncertain" and routed to review, and use those logs to grow the regex rules and training set.
- Evaluate harder. Hold out a human-verified set, split train and test by job or time so repeat failures from one incident do not leak across, and monitor class share and confidence for drift.
- Stop waste at the source. Pre-flight health checks on vmpooler and Artifactory before provisioning, retry caps with a circuit breaker, and guaranteed VM release in post-build steps with a short lease TTL as a backstop.
- Harden the pipeline. Persistent queues in Logstash and an alert when an instance stops sending logs, so silence is never mistaken for success.
Closing thoughts
The biggest win was not any single model or tool. It was being able to see failures by cause. Once we could, the next steps were practical: spread out scheduled jobs that competed for VMs, stop chronically failing jobs from consuming capacity, and point each failure at the team that can fix it.
Three choices carried the project: keep analysis off the system that is already failing, combine regex precision with ML coverage behind a reviewable pull request flow, and let a weekly report carry long-term trends instead of storing ever more raw logs.
If you run CI at scale and have tackled failure analysis a different way, I would like to hear about it in the comments.
Tech stack
Jenkins (4 instances, GKE agents) · Logstash with the Jenkins Logstash plugin and Grok · Elasticsearch (daily indices, 60-day retention) · Grafana Cloud with Private Data Source Connect · Python, scikit-learn and FastAPI · Claude with the Grafana MCP server (read-only) · Puppet and GitHub Actions · Slack and SharePoint · vmpooler, Artifactory